Introduction
Turbidimetry is a major assay principle of measurement of clotting time and is used in many coagulometers in current use in clinical laboratories. Briefly, as fibrinogen is converted to fibrin, it acquires a structure favorable to lateral aggregation, and a branching fibrin clot can be formed, increasing the viscosity of the plasma to that of turbid gel. The relation between microscopic web-like fibrin clot structures and increase in turbidity was demonstrated in detail by Chernysh et al. [1]. Clotting time partly represents the overall turbidity change such that prothrombin time (PT) is the time required for the first derivative of the turbidity curve to reach its local maximum, and activated partial thromboplastin time (APTT) is that for the second derivative to reach its local maximum value. However, clotting time is only a partial representation of the whole feature of the clotting reaction, and additional parameters obtainable from turbidimetry data can help to understand the overall turbidity behavior. The derived fibrinogen activity as reported as an add-on of PT is an example [2]. This measure is derived from the height of the turbidity curve plateau, an important aspect of the curve, and is also physiologically relevant in that it represents the average thickness of fibrin fibers of the clot. Also, the absolute values of the heights of the two local maxima of the first and second derivatives of the turbidity curves (peaks 1 and 2) are good candidate parameters representing clotting. Although the two parameters were originally derived to determine the time points of clotting, peaks 1 and 2 provide additional intuitive information regarding clot formation because they are the rate and driving force or acceleration with which fibrin clots are formed. Shima et al. introduced peaks 1 and 2 measured from APTT as possible assay targets to assess the hemostatic status of hemophilic plasma [3-5]. Peaks 1 and 2 of APTT showed good correlation with coagulation factor FVIII quantity or activity of the plasma samples, while the APTTs themselves were inversely correlated. However, the relations of the two peaks with conventional clotting time were observed in highly controlled conditions with varying coagulation factor VIII quantity. The status of these relations in various clinical conditions and the usefulness of such information in clinical decision making need to be thoroughly evaluated. For that kind of evaluation to be practically executed, baseline characteristics including repeatability, correlation to other coagulation tests, and reference intervals for normal healthy individuals should be determined. In this respect, we evaluated the repeatability of peak 1 and 2 tests in pooled plasma samples. We also examined the relations between APTTs and peak 1 and 2 values and derived normal reference intervals for these parameters.
Methods
Derivation of peak 1 and peak 2
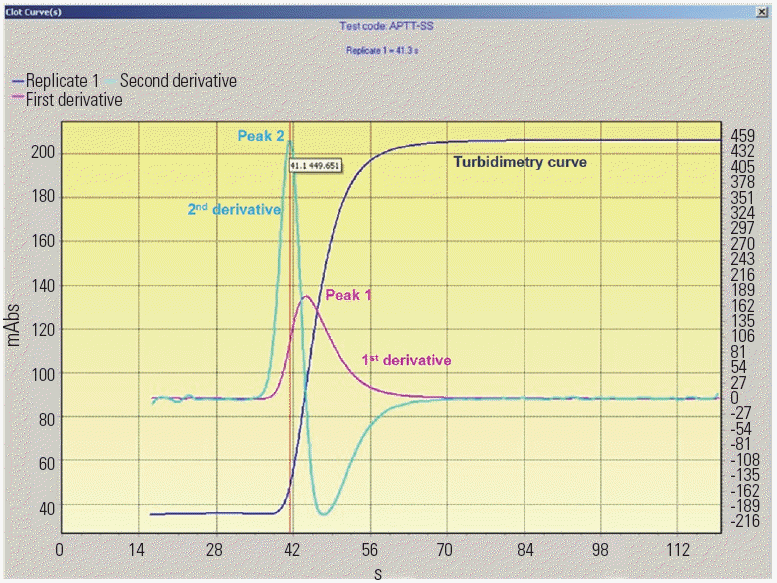
Every APTT test was conducted using an automated coagulometer ACL TOP 700 (Instrumentation Laboratory, USA). During an APTT test, the coagulometer measures the turbidity of a plasma-reagent mixture more than 1,000 times. Thus, for each APTT test, there is a series of normalized turbidity values plus first and second derivative values obtained through numerical methods along with time points of measurements. The first and second derivative values are scanned, and the maximum values that are in line with adjacent time point values are chosen to be named as peak 1 and peak 2. A typical turbidimetric curve with overlying first and second derivative curves is shown in Fig. 1. Peak 1 and peak 2 values were derived from APTT data stored in the operating computer. Briefly the APTT turbidimetry data were converted into csv file format and analyzed using a spreadsheet program. Each series of first or second derivative values were scanned for local maxima, which were then chosen as peak 1 and 2 values, respectively. The unit of turbidity was arbitrarily defined as turbidity unit (TU), and those for peaks 1 and 2 were TU/sec and TU/sec2, respectively.
Collection of plasma
Two pooled plasma samples were prepared from patient referred to our clinical laboratory for APTT. One was pooled from samples with normal APTT results, and the other from those with APTT longer than 60 seconds. Simple short-term repeatability tests were performed by repeating APTT 20 times in a single run for each pooled sample. APTT data from 45 patients with results distributed evenly over the measurable range were selected, and peak 1 and peak 2 values were extracted for correlation analysis. Reference values were collected by derivation of peaks 1 and 2 from stored APTT data from 115 apparent healthy adults.
Statistical analysis
All relevant statistical analyses including calculation of statistics (mean, standard deviation, coefficient of variation), correlation analyses with scatter plot representations, analyses of parameter distribution, comparison of means and variances, and determination of reference intervals were conducted using MedCalc ver. 15.10.1 (MedCalc Software, Belgium).
Results
Baseline evaluation
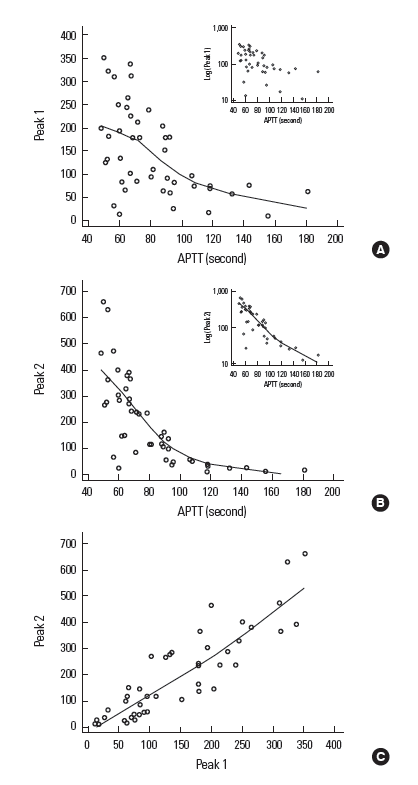
Within run repeatability of peak 1 and peak 2 was examined from two preparations of pooled plasma, one with normal and the other with moderately prolonged APTT. As summarized in Table 1, CV values of peak 1 (3.8% for the normal APTT pool plasma and 4.8% for the prolonged APTT pool plasma) were less than 5.1%, which is the clinically allowable limit of imprecision of APTT suggested by Westgard et al. [6]. Peak 2 results were more variable, with CV values higher than 10% for the samples with prolonged APTT. The variability of APTT results was minimal for both of the two pooled plasmas. We then examined the relation between APTT and peak 1 and peak 2 values that were randomly selected from the stored data of APTT. As shown in Fig. 2A, the peak 1 value showed an inverse relationship with APTT, and the correlation was significant but not strong (correlation coefficient r: -0.5324; 95% confidence interval: -0.7143 to -0.2832). The relation was not linear, which was apparent from the trend line, and the correlation coefficient changed little after log transformation of peak 1 value (r: -0.5242; 95% CI: -0.7087 to -0.2726). Peak 2 value showed stronger correlation with APTT (r: -0.6917; 95% CI: -0.8190 to -0.4996), and log transformation of peak 2 significantly strengthened the relation with APTT (r: -0.8257; 95% CI: -0.9009 to -0.7024). As expected, the peak 1 and peak 2 values correlated well, supporting that higher clotting acceleration indicates higher clotting velocity (r: 0.8810; 95% CI: 0.7924 to 0.9332). The relation appeared almost linear.
Reference interval
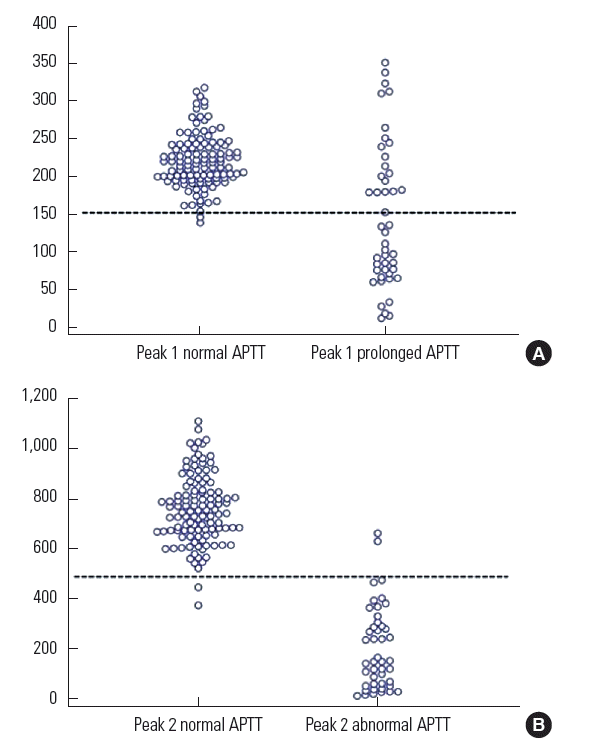
Reference intervals of Peak 1 and 2 values were derived from 115 apparently healthy individuals including 60 females. Because the origin of the data was APTT included in health check-up tests, we could not include the data from pediatric patients. Patient age ranged from 26 to 79 years, and no parameter included in the analysis showed significant correlation with age. Both peaks 1 and 2 as well as APTT were normally distributed. However, peaks 1 and 2 were closer to normal distribution than APTT, which showed high degree of peakedness (i.e., increased kurtosis such that the distribution is concentrated around the mean). The distributions of peak 1 and 2 values in both sexes were not different from each other, and pooled reference intervals were derived as 150.0 to 290.7 TU/sec and 488.4 to 1,026.3 TU/sec2, respectively, calculated as mean±standard deviation. Other statistics related to reference intervals and non-parametric reference intervals are summarized in Table 2. As expected, 96.5% of APTTs obtained from these subjects were within the reference interval. When peak 1 and 2 values from prolonged APTT were compared with those from reference subjects, both showed significant differences in the respective means between the two APTT groups. However, peak 1 values from prolonged APTT showed significant overlap with the reference interval of peak 1, while only two peak 2 values from prolonged APTT were within the reference interval of peak 2 (Fig. 3).
Discussion
Fibrin clot formation is an essential component of hemostasis and can be assessed and characterized in a number of ways. As the weblike micro-structure of a fibrin clot forms in plasma, it progressively increases the turbidity such that the light transmittance through the plasma decreases accordingly. This can be exploited to detect fibrin clot formation (i.e., turbidimetry) and has been adopted in many modern coagulometers used in clinical laboratories to measure clotting time. As addressed by Chernysh et al., the growth of the microscopic structure of a fibrin web is closely related to turbidimetric change. For example, the initial appearance of the stable scaffold of a fibrin web is temporally related to an initial increase in the turbidimetric curve from baseline. The maximum turbidity increase is related to the thickness of fibrin fibers in general [1]. Also, the process of fibrin formation can be monitored, and information regarding the rate of turbidity increase reflecting clot formation rate (peak 1) and/or the acceleration of turbidity change (peak 2) can be derived. Thus, plasma clotting can be assessed in various aspects, which need to be evaluated for relationship to hemostasis and clinical usefulness. However, most coagulation tests in current use in clinical laboratories are based on measurement of clotting time, which is the time required for the forming clot to be detected after the reagents are added. The time point to measure the clotting time is that of the local maximum of the turbidity increase rate or acceleration. In effort to introduce the rich information attainable from tubidimetric assessment of ex vivo clot formation, we first evaluated basic metrologic performance of peak 1 and peak 2 of APTT turbidimetric curves and derived a reference interval for each from the stored turbidimetry data of APTT performed on apparently healthy individuals. The within-run CVs of peak 1 were below the clinically maximum allowable imprecision. Further work to determine the statistics for between-run and total imprecision will be performed in the future study. The repeatability of peak 2 was rather poor, and additional study to obtain a more comprehensive picture including plasma samples with various APTT and peak 2 levels is also needed.
The present findings are different from our previous observation where much lower or similar peak 1 and 2 CVs compared to APTT CVs were obtained from coagulation factor VIII calibrators. The calibrators included in that study almost lacked factor VIII (factor VIII activities 0.0 to 2.0%) such that APTTs were much longer than those observed in the present study. Possibility of improved precision of peak 1 and 2 in plasmas with more prolonged APTT needs to be examined in detail. Peak 1 value inversely correlated with APTT, but the relation was not strong. Peak 2 showed a stronger relation to APTT. It is understandable that plasma with a more active coagulation system more quickly reaches a certain point of most precipitous clot formation. However, from our results, it is evident that high fibrin formation rate does not necessarily mean normal clotting time. For protection from bleeding, a fully organized fibrin structure is necessary. Our results indicate that, although clotting starts somewhat later (prolonged clotting time) than the upper reference limit, the hemostatic amount of fibrin clot can still be achieved if the subsequent clot formation rate is sufficiently high. It would be valuable to prove this hypothesis for predicting and managing bleeding risk. No case of normal APTT with low peak 1 was found in our study but deserves to be monitored continuously in clinical samples because this might represent a novel indicator of bleeding risk.
Peak 2 was different from peak 1 with regard to overlap between reference and prolonged APTT groups. The possible explanation is that the persistence of a certain level of acceleration and thus the driving force of clot formation, even if its highest peak is not that high, can still produce a significantly high clotting rate peak (peak 1). This also needs to be further analyzed with mathematical consultation. Finally, we derived reference intervals for peak 1 and peak 2 from apparently healthy individuals. Although the reference intervals were determined in adults, and an age effect needs to be examined more thoroughly, Our study is a starting point that will aid in the study of hemostatic meaning of the new coagulometer parameters peak 1 and 2 and on the evaluation of their clinical usefulness.


